Bird Chirp Signal Analysis using Handcrafted Signal Processing Features
The BirdCLEF competition, hosted on Kaggle, is a large-scale bioacoustic benchmark designed for automatic bird species identification using audio recordings. The dataset consists of field recordings collected from diverse ecological regions, containing bird vocalizations along with environmental noise such as wind, insects, and human activity.
These challenges—background noise, overlapping calls, class imbalance, and environmental variability—make it the perfect testbed for evaluating both classical signal processing and modern machine learning approaches. Below, we explore the time-frequency representations of these signals, extract critical handcrafted features, and compare results between two distinct species (Bird 1 and Bird 5).
1. Signal in the Time Domain
The raw waveform provides an initial understanding of chirp structure, amplitude variation, and temporal sparsity.
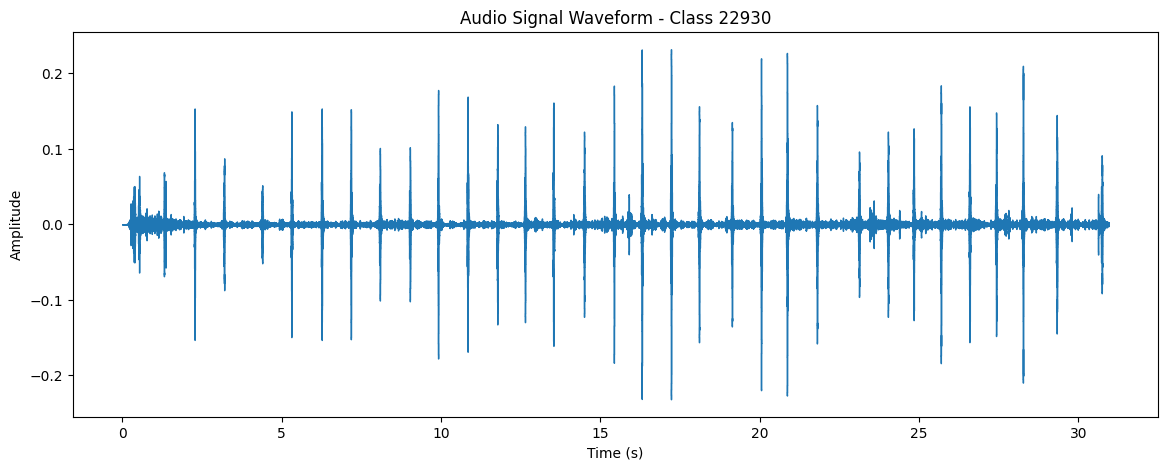
Observations from the Time Domain:
- Uniform spacing between chirp frquencies over time
2. Frequency Sweep Features
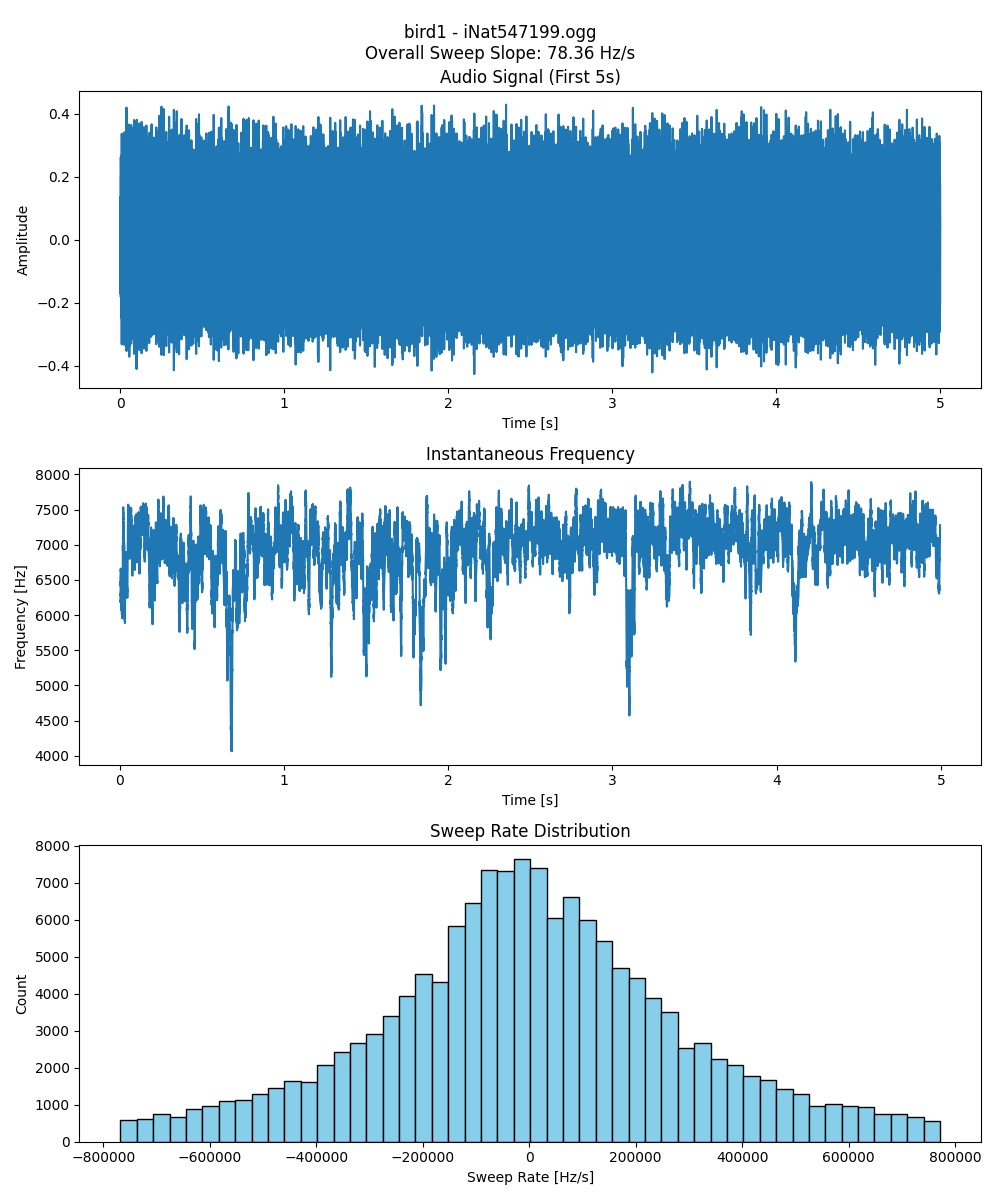
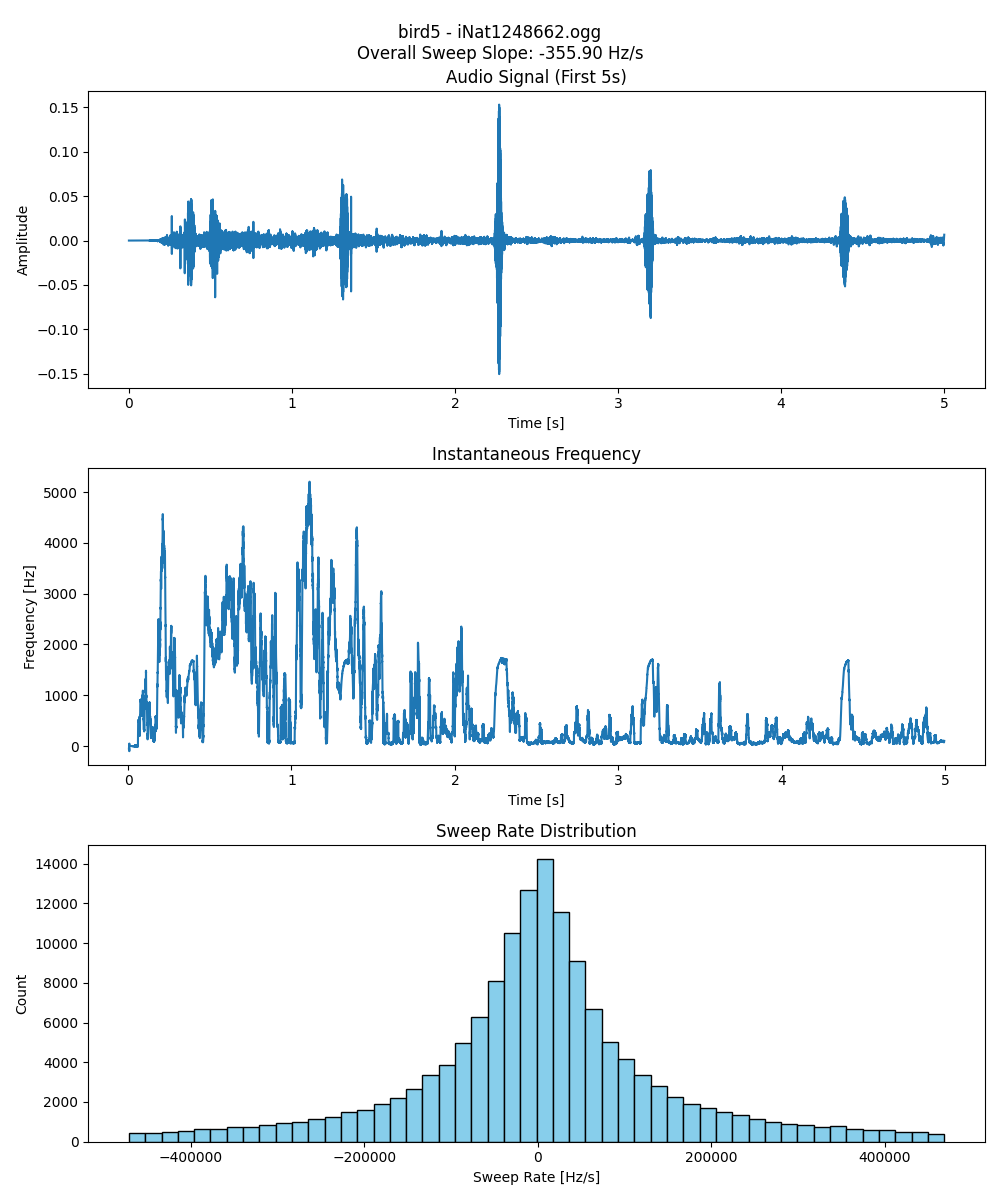
Observations:
- Both birds exhibit different signal characteristics: a) Bird 1 signal is continuous which represents territorial display, b) Bird 5 signal is discrete which represents alerting/communicating behaviour.
- Bird1: Stable frequency Band, Bird5: High Variational Frequency band - More information encoded by bird5.
- Bird1: Complex sweep rate, Bird5: Narrow sweep rate - Bird1: Richer Acoustic structure.
3. Harmonic Features
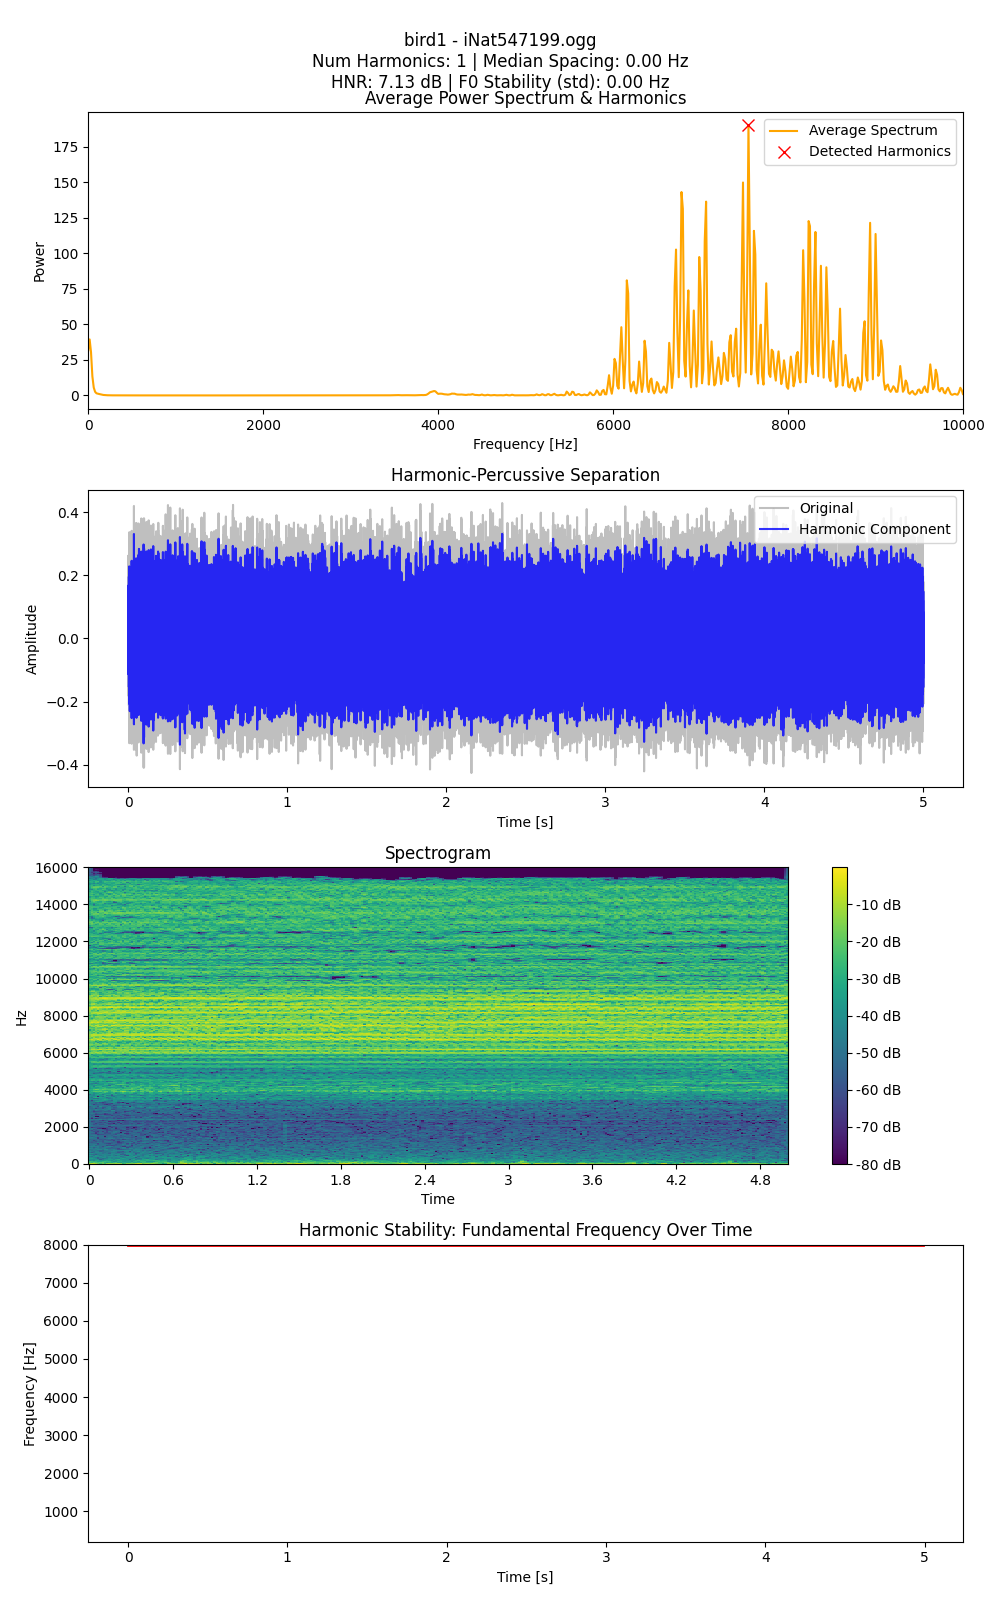
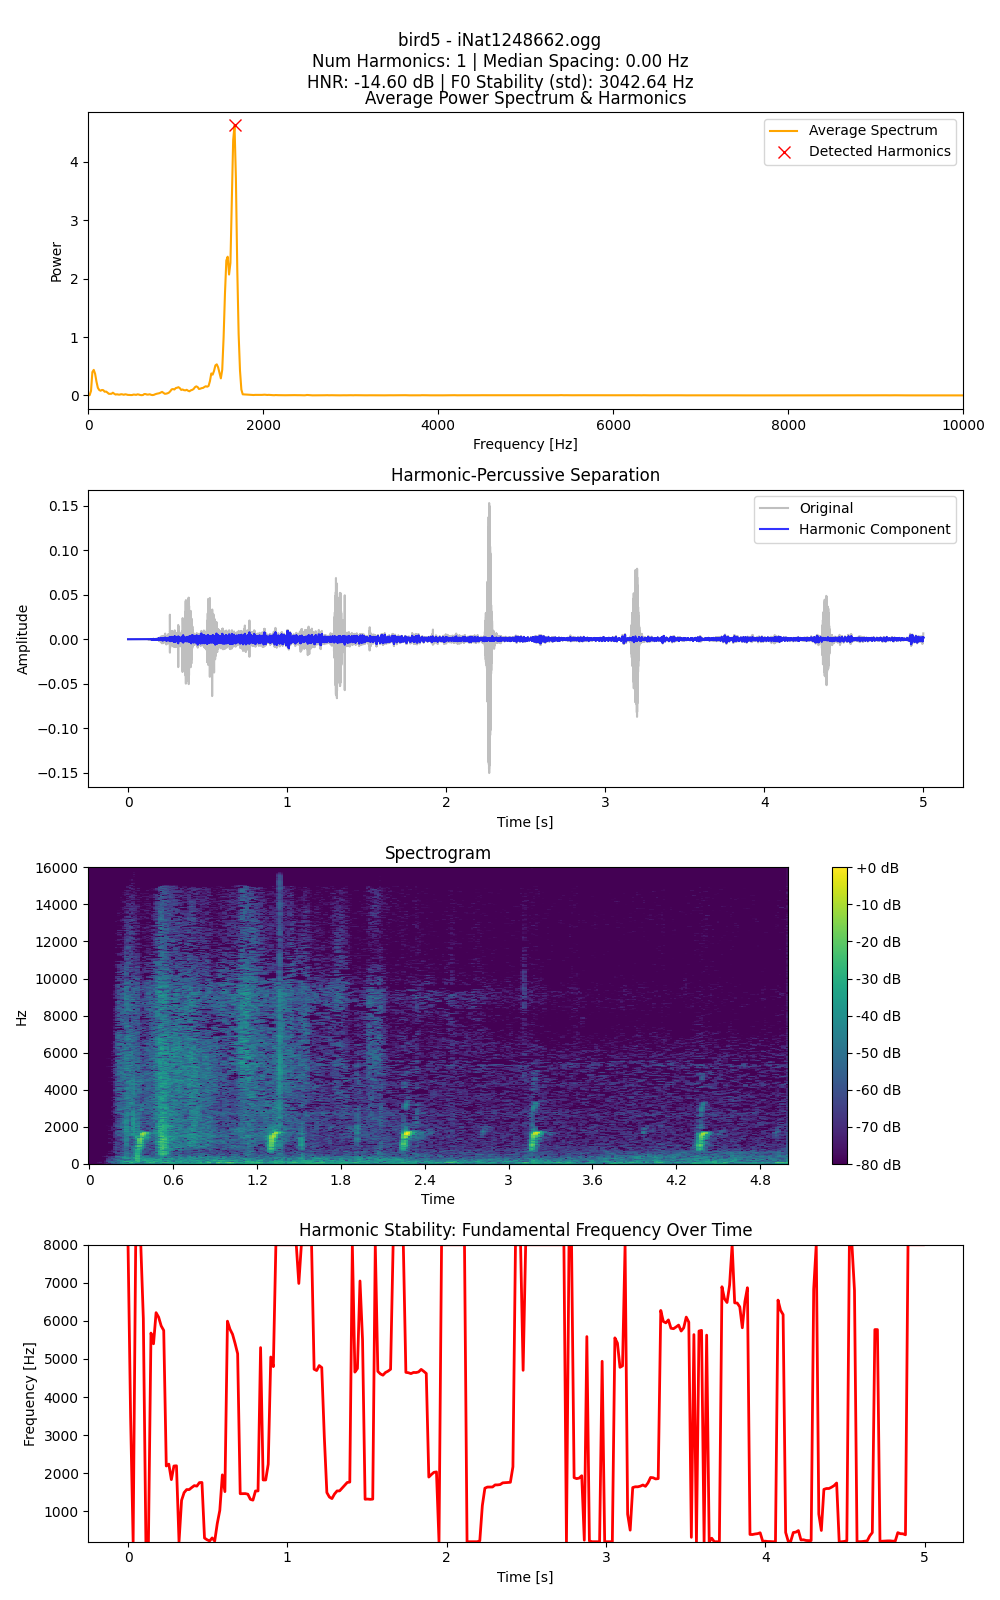
Observations:
- Tonal species show clear, stacked harmonic structures.
- Noisy calls exhibit blurred or entirely absent harmonic periodicity.
4. Temporal Features
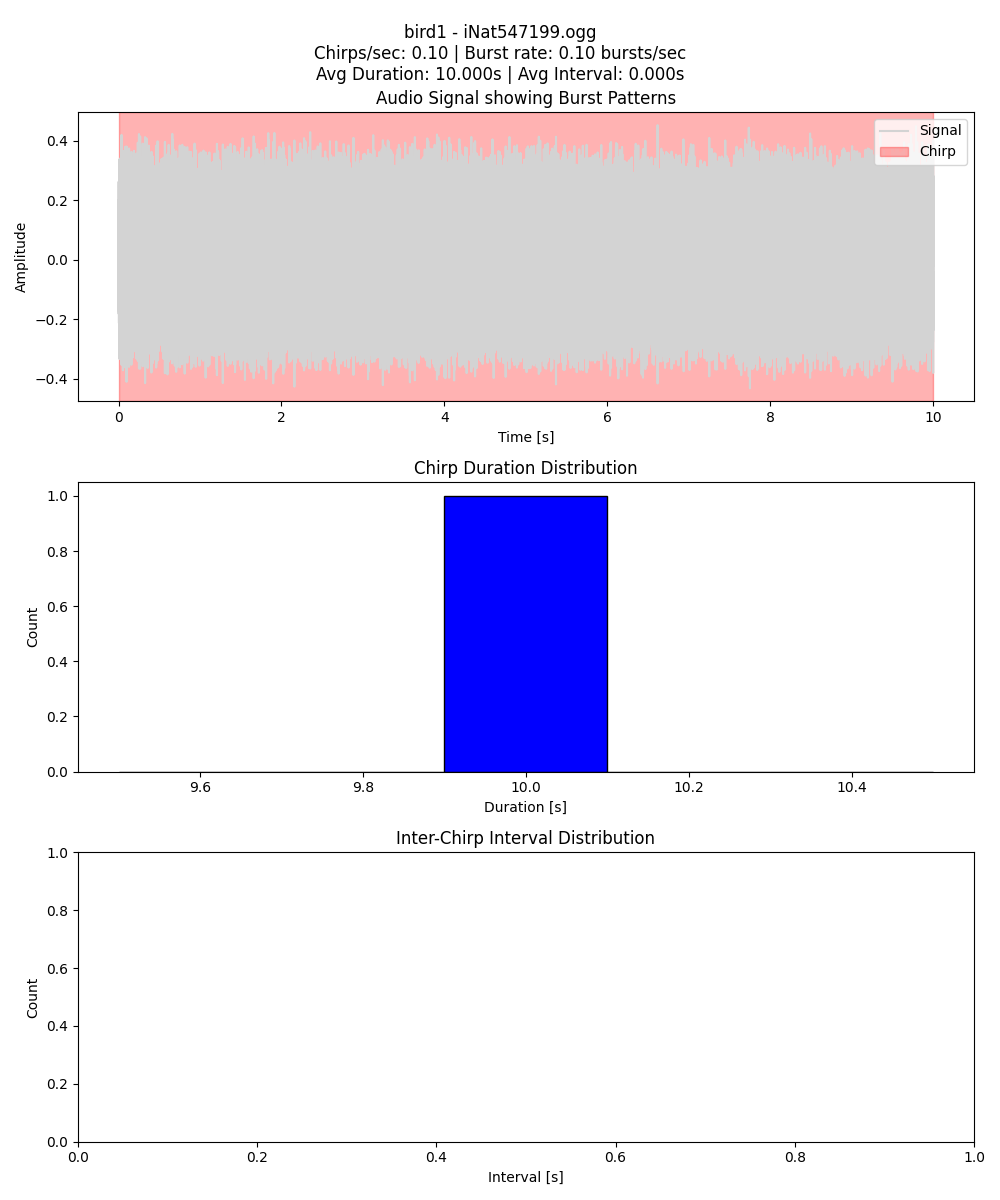
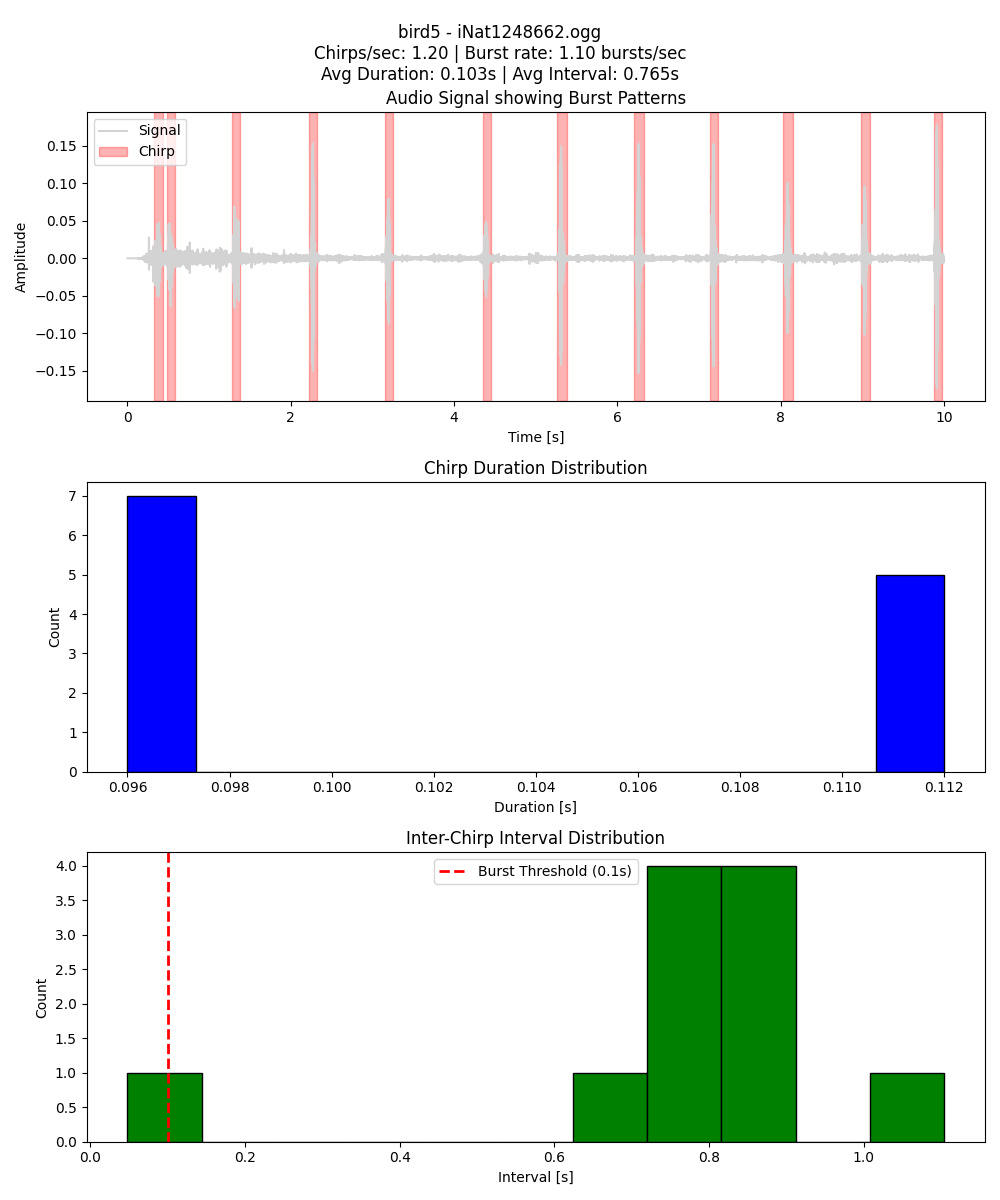
Observations:
- Bird 1 shows highly regular chirp intervals (steady rhythm).
- Bird 5 exhibits irregular, burst-like temporal calling patterns.
5. Spectral Features
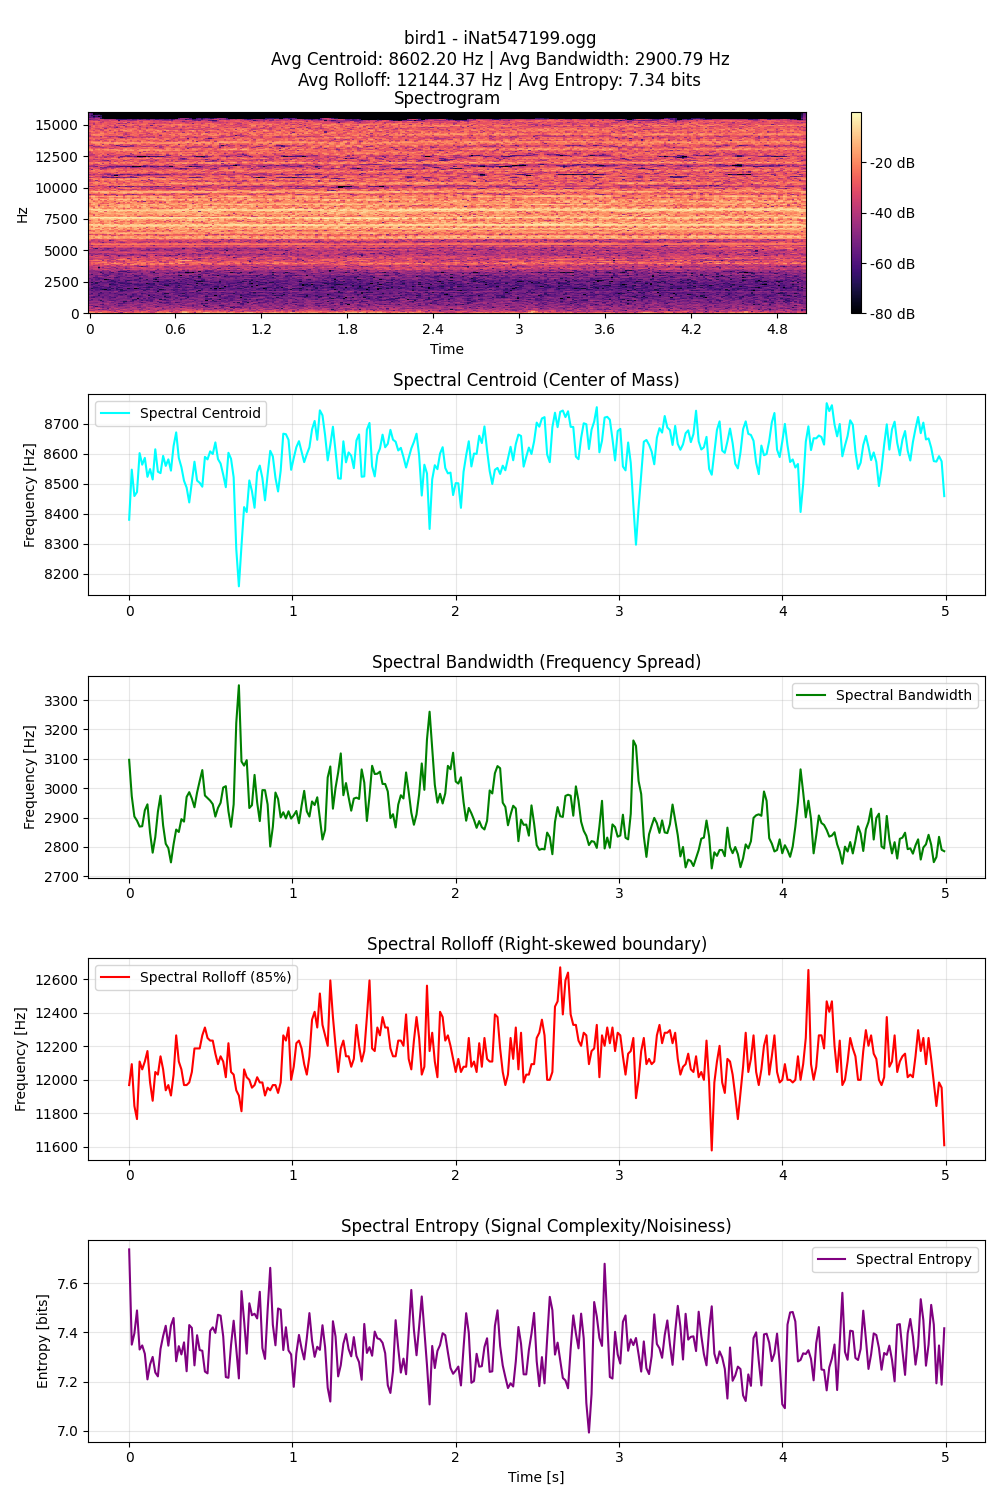
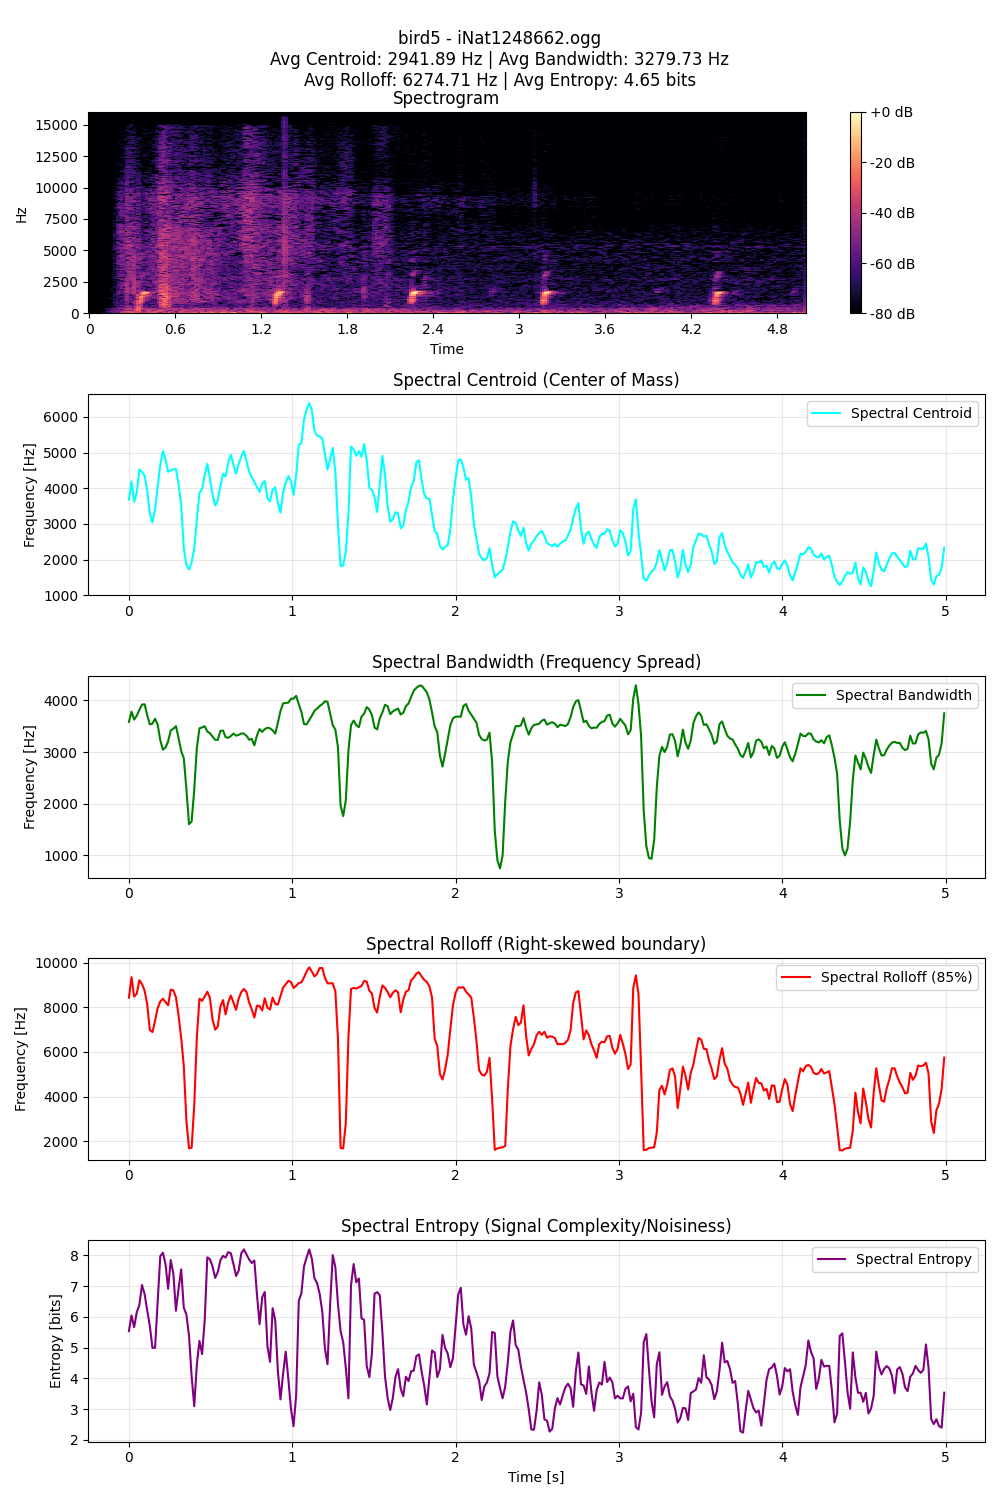
Observations:
- A higher centroid indicates high-frequency dominant chirps.
- Bandwidth successfully differentiates narrowband whistling from broadband complex calls.
6. Modulation Features
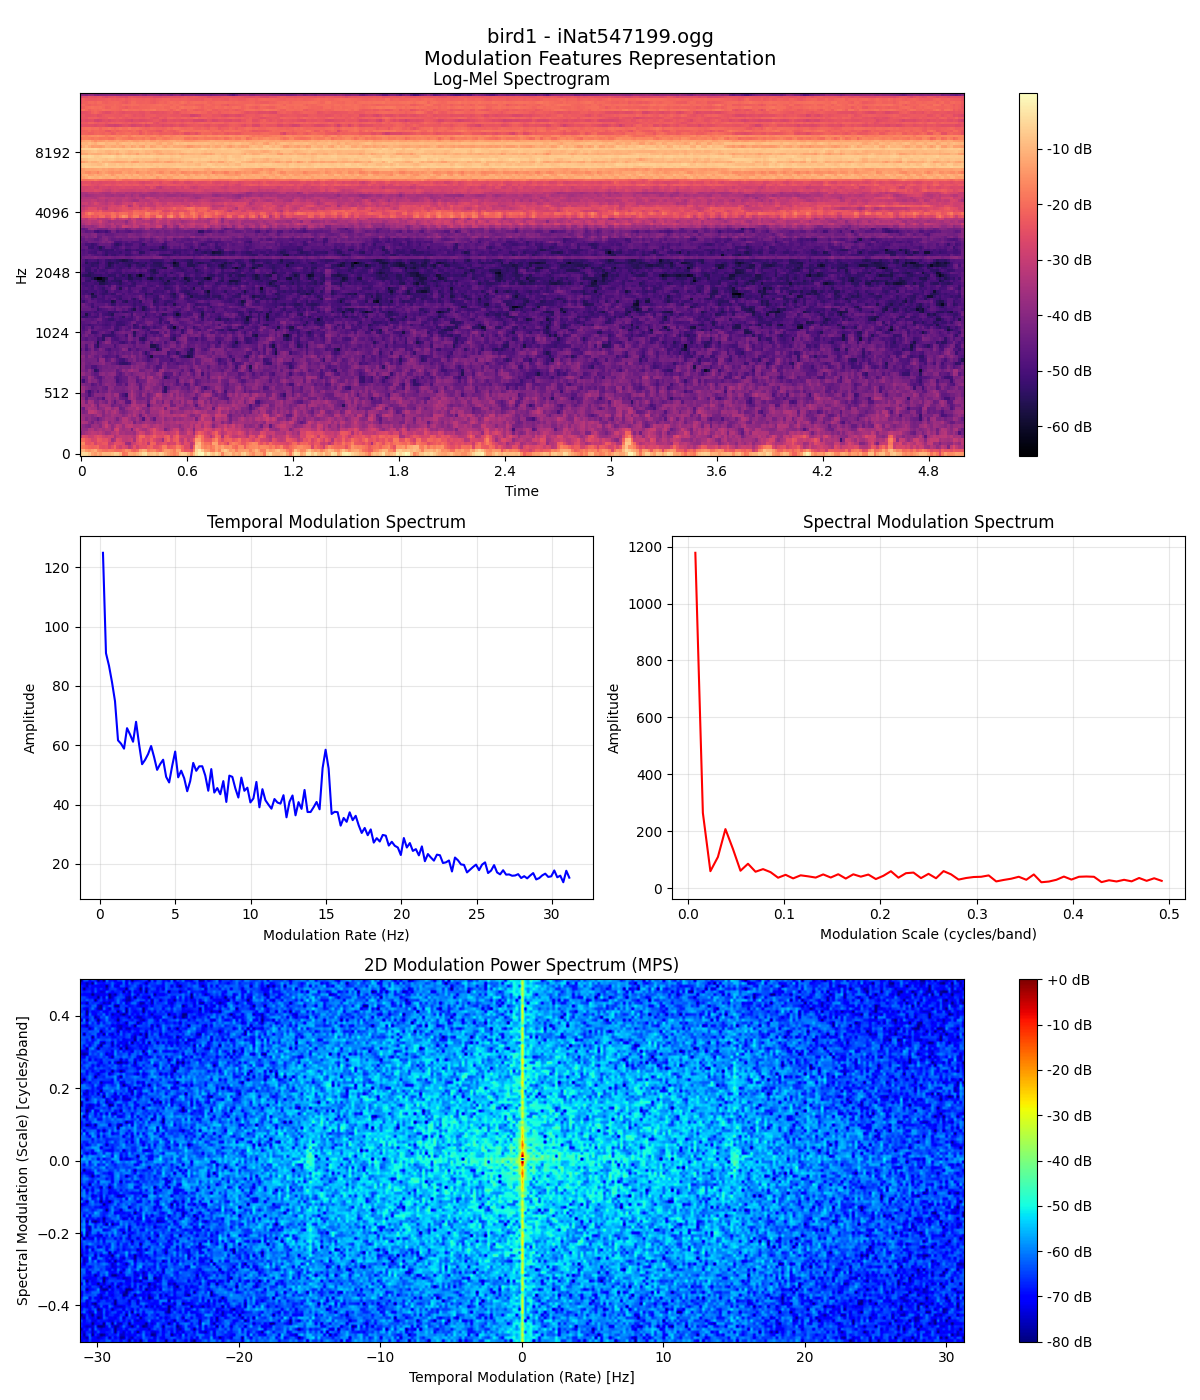
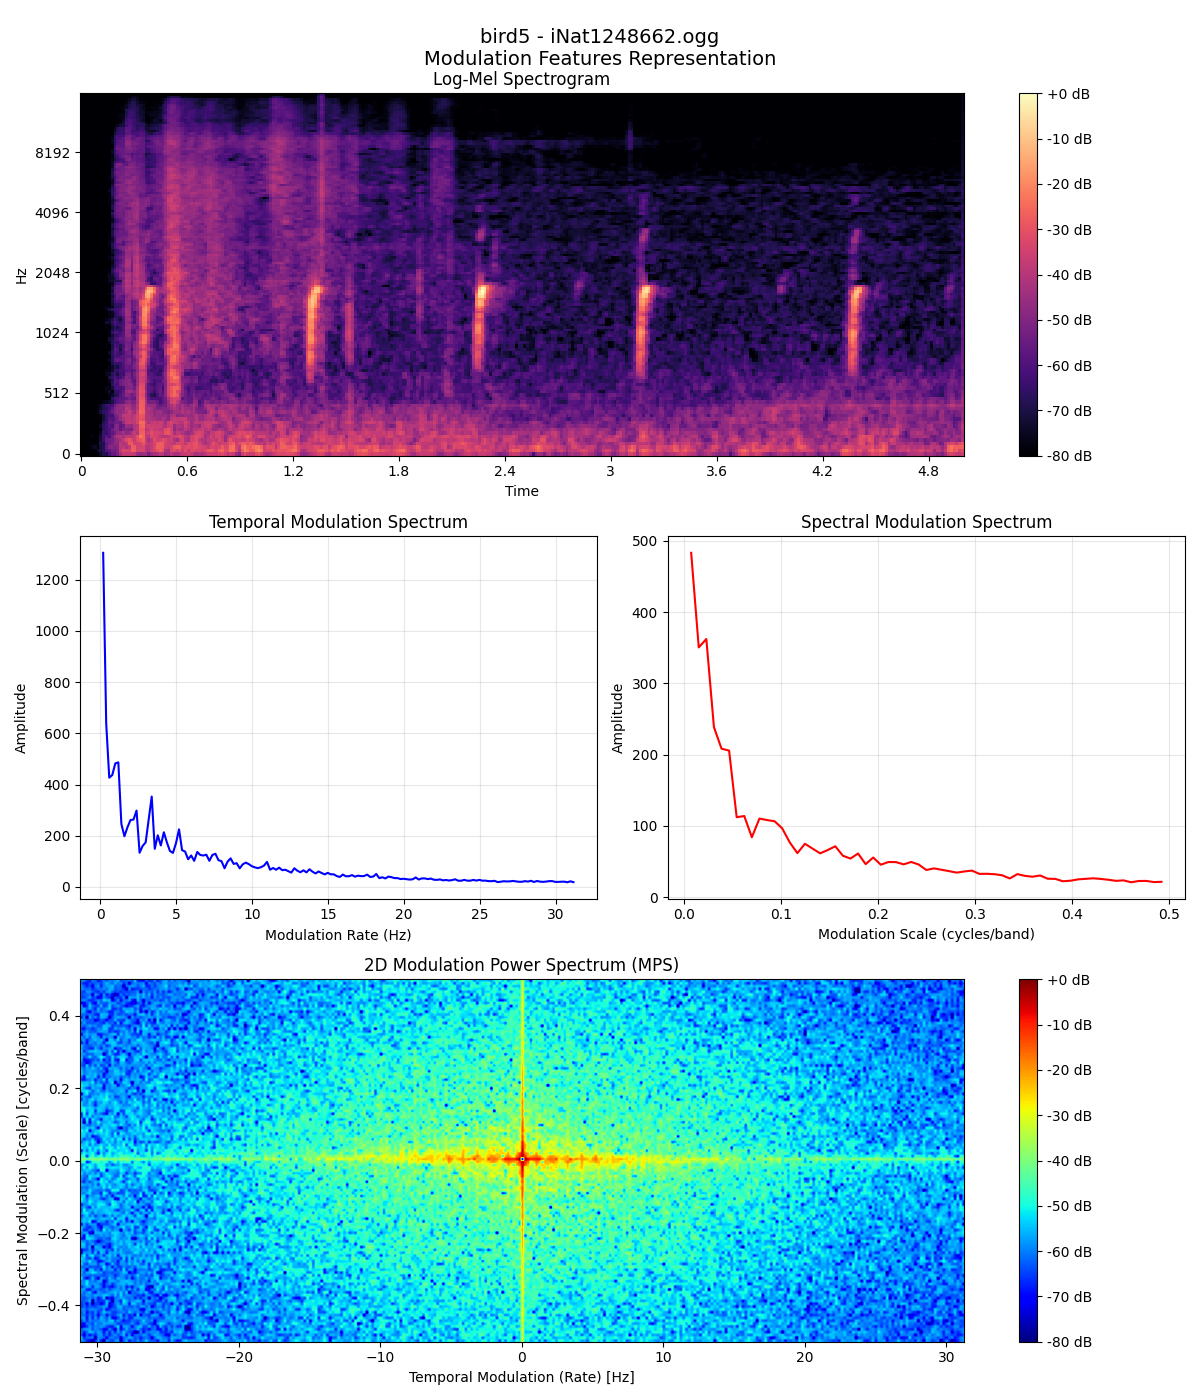
Observations:
- Fast temporal modulation corresponds to rapid trills.
- Slow temporal modulation aligns with isolated, spaced chirps.
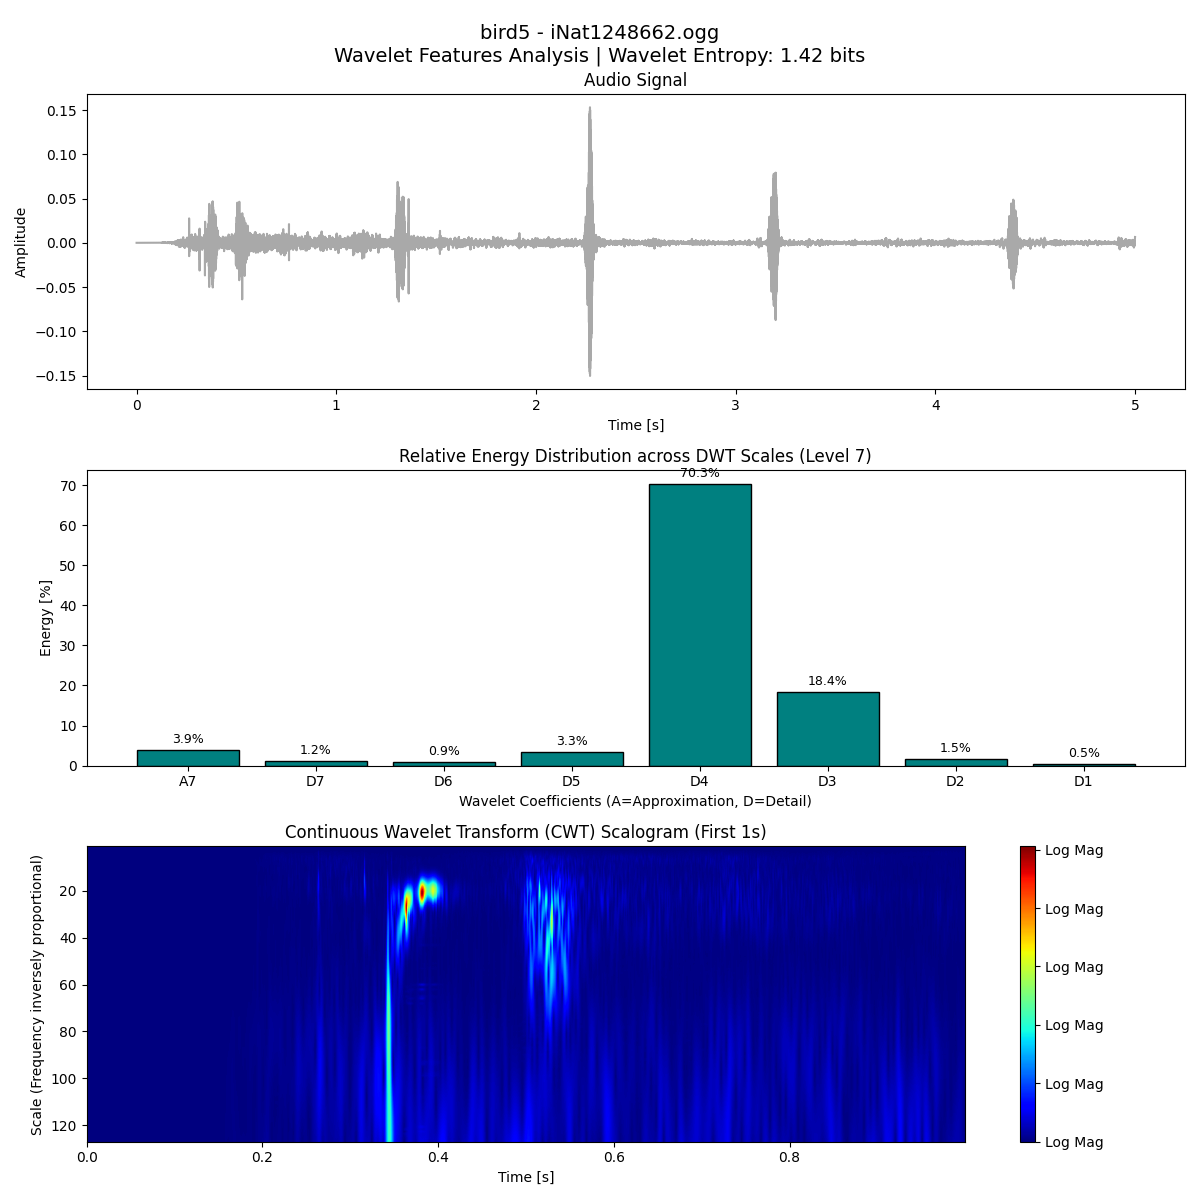
7. Wavelet Features
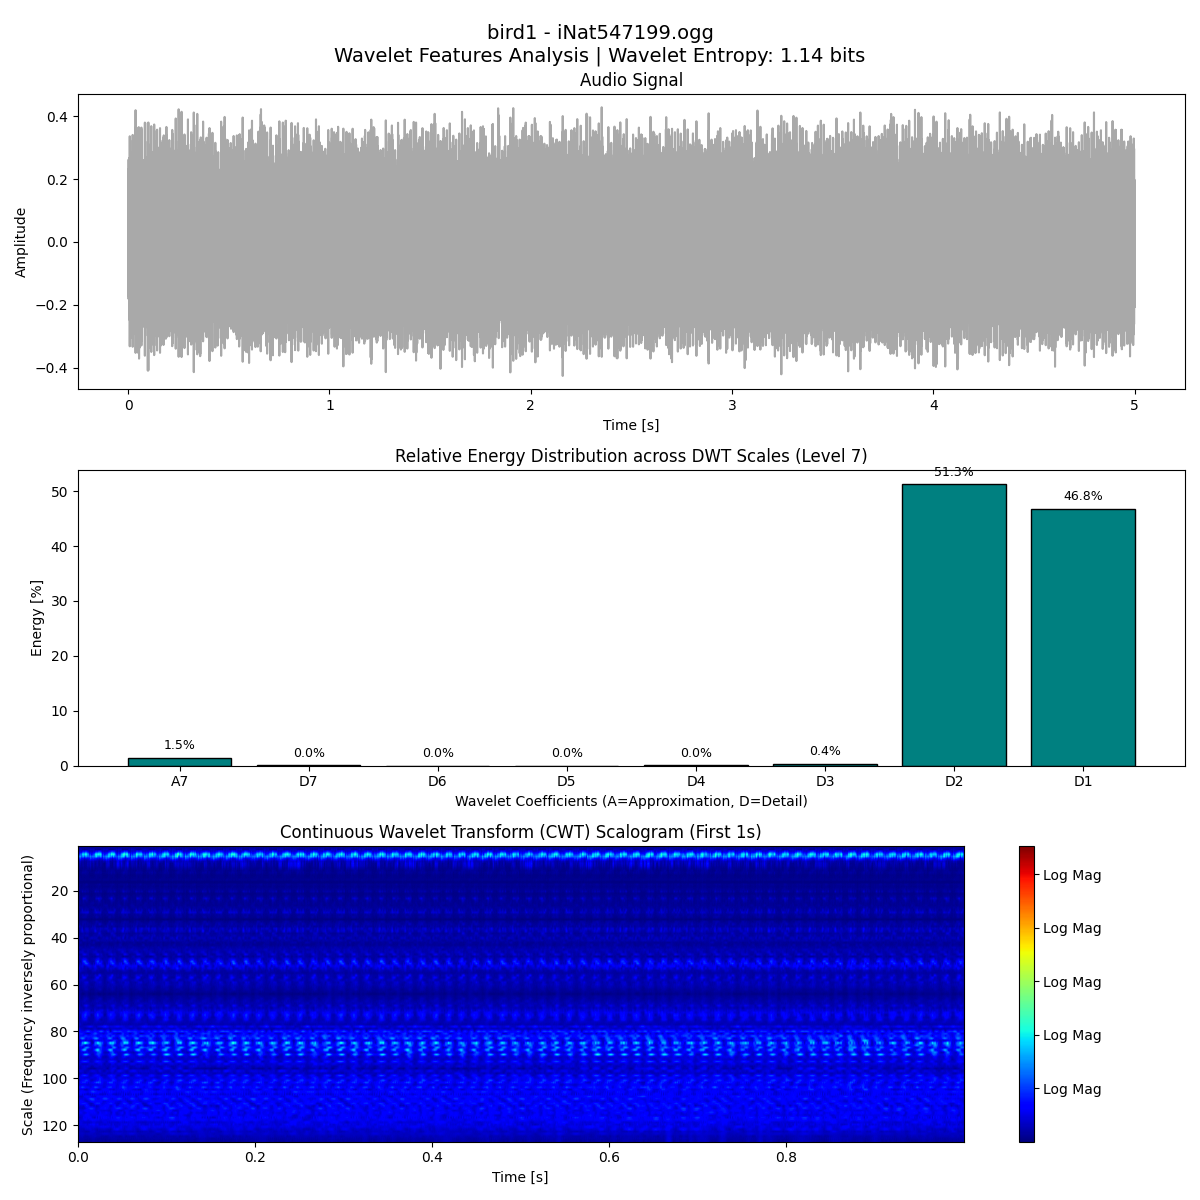
Observations:
- Chirps appear strongly at highly specific wavelet scales.
- Different species show fundamentally distinct scale-energy distributions, separating high and low-frequency calls.
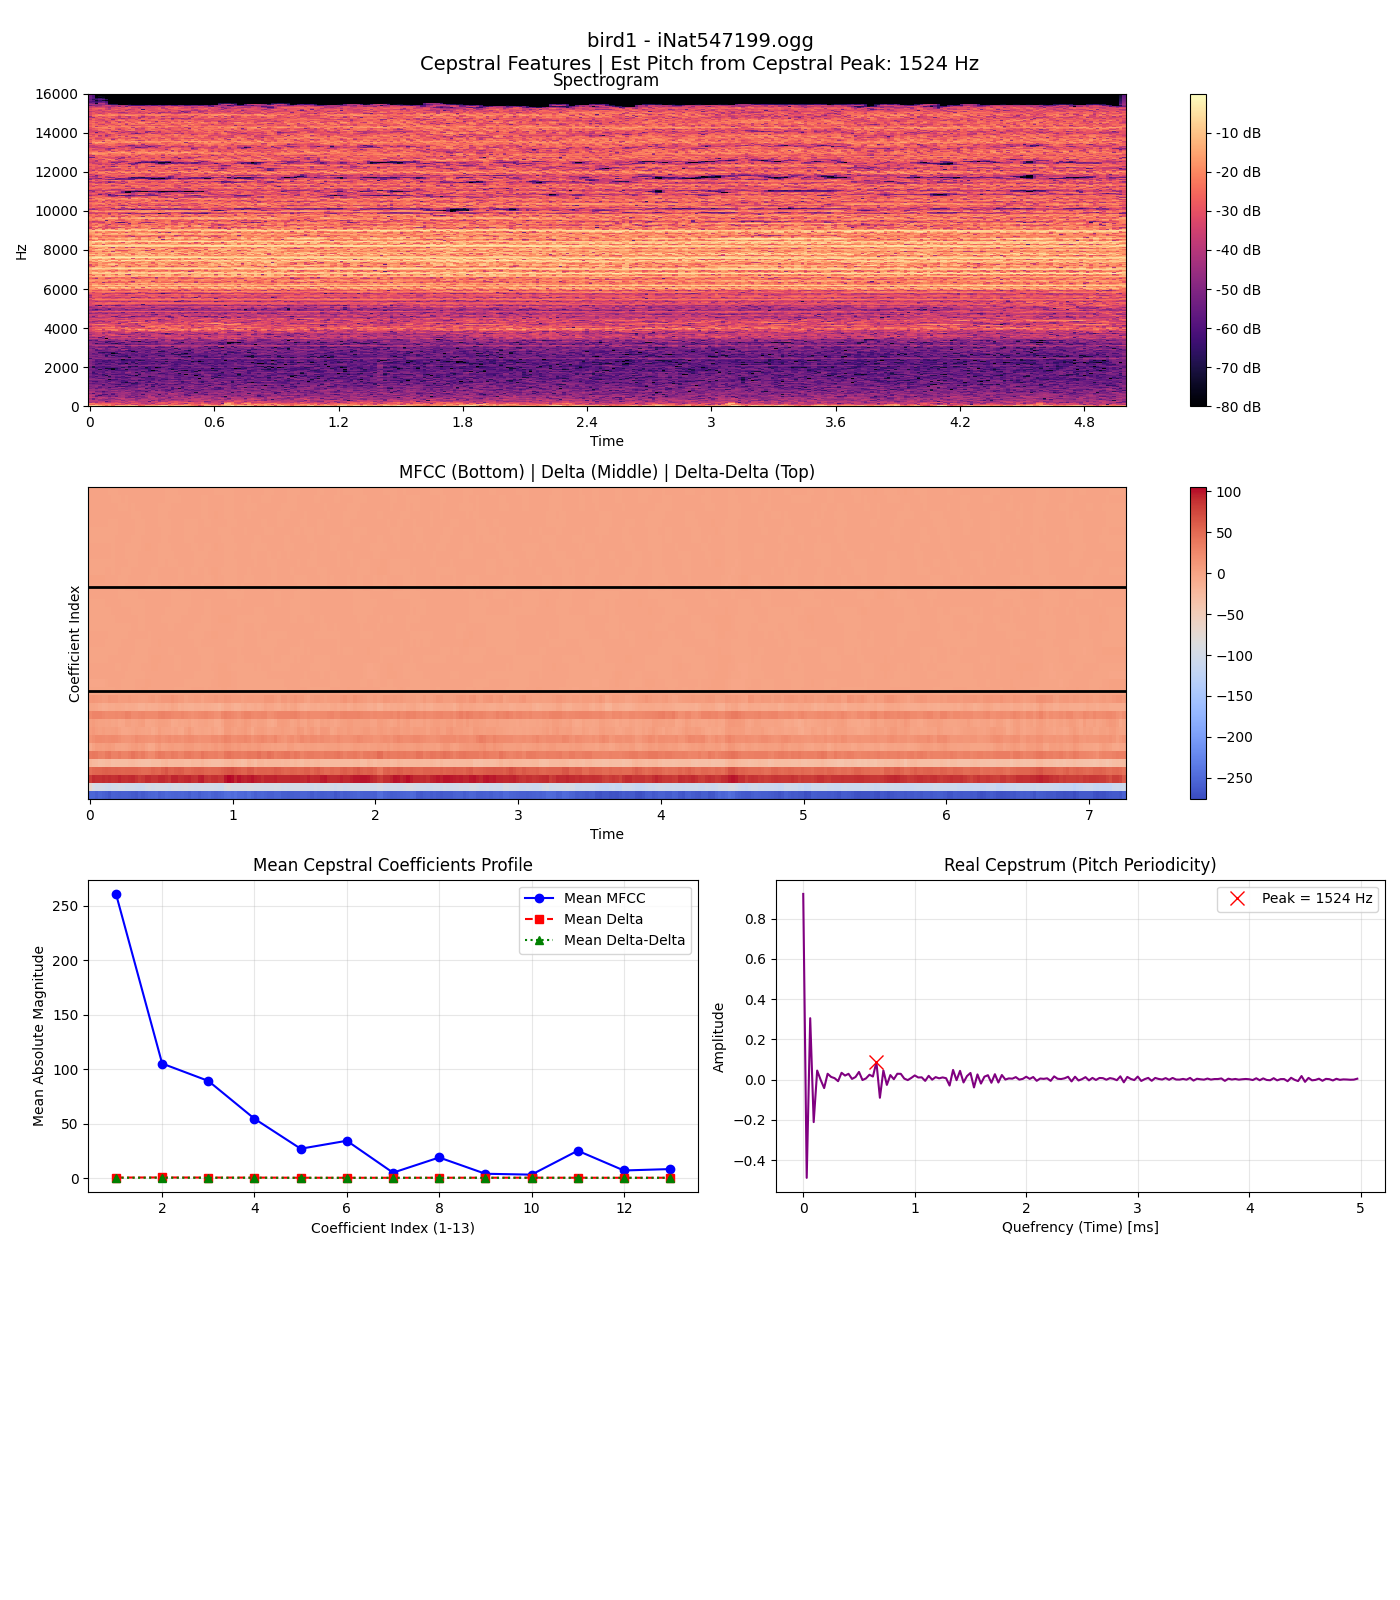
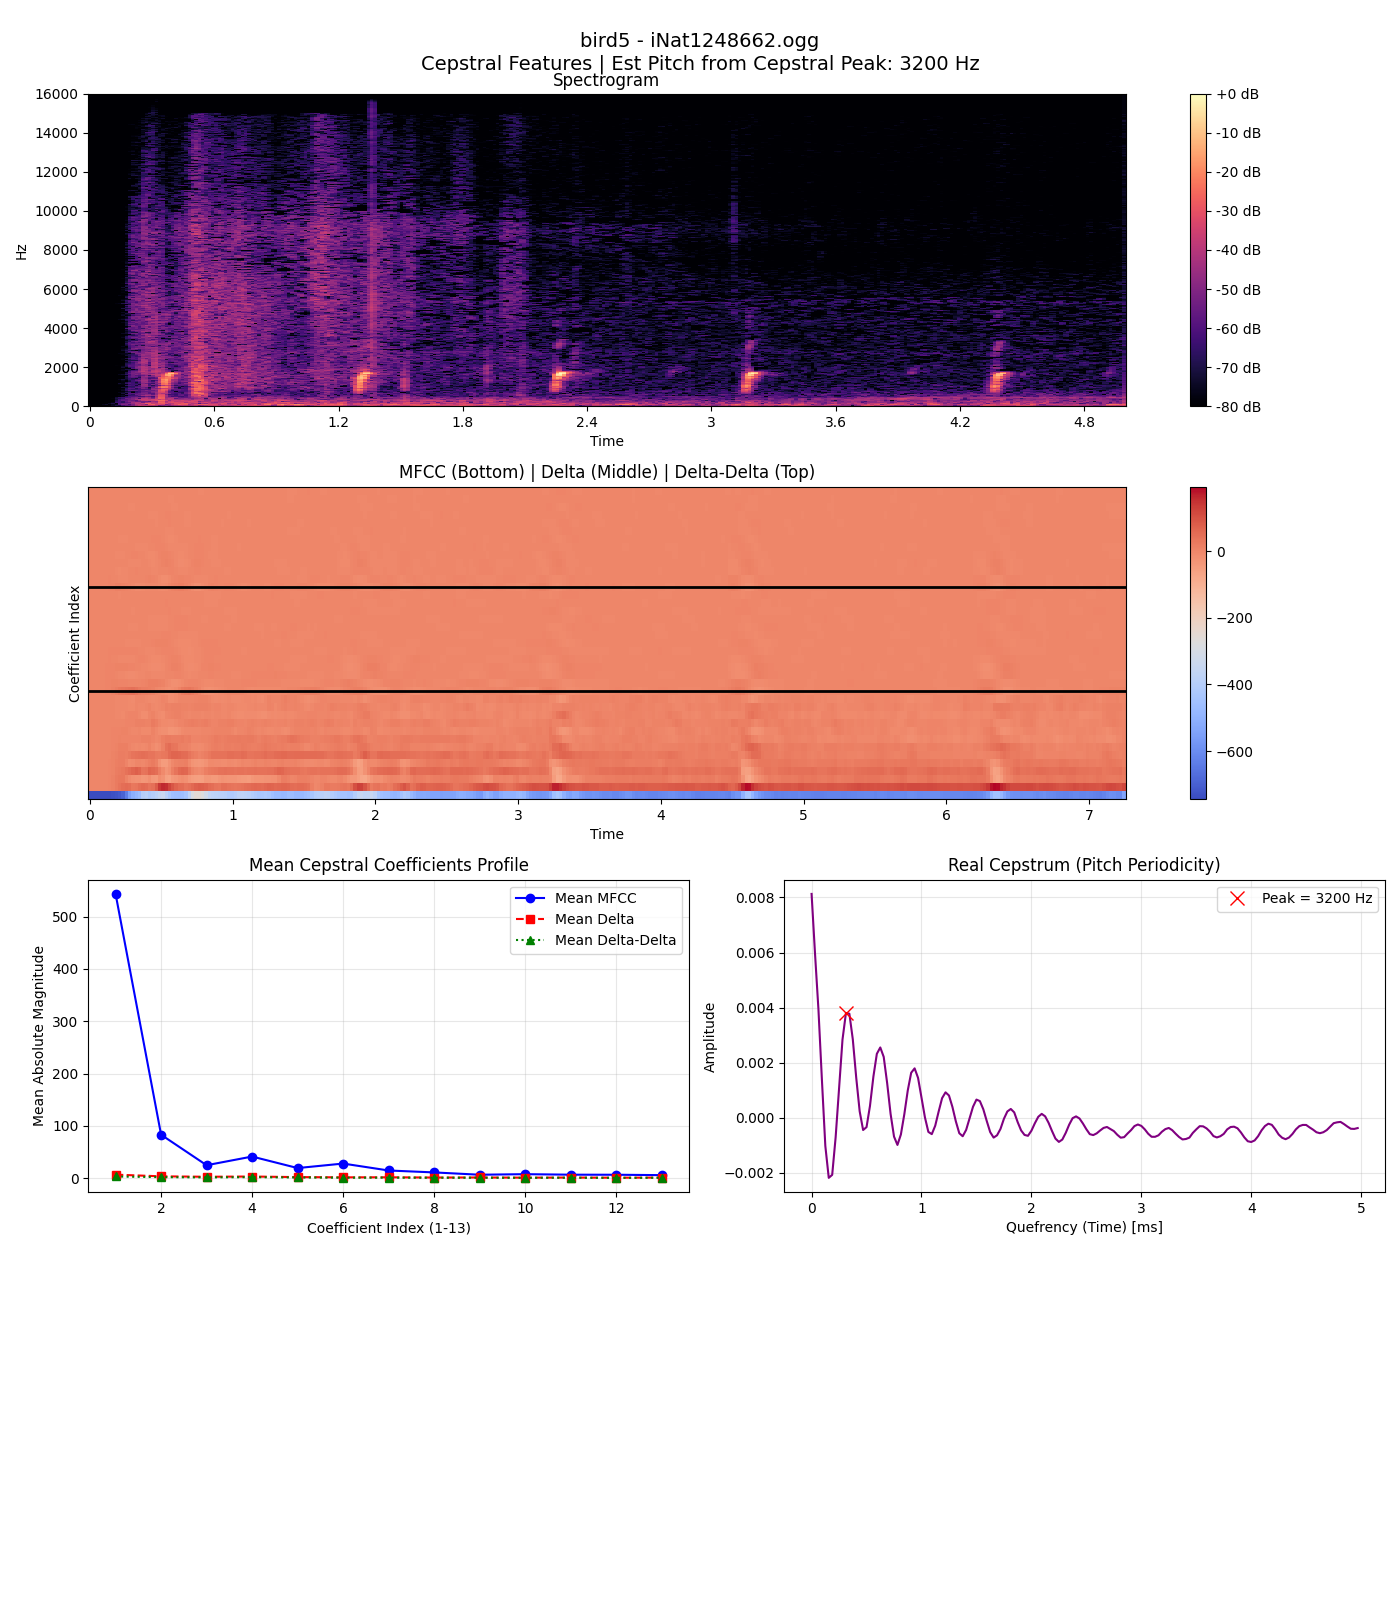
8. Cepstral Features (MFCCs)
Observations:
- MFCC patterns differ drastically across species, providing a compact envelope representation.
- Tracking the temporal evolution of these coefficients heavily improves species discrimination.
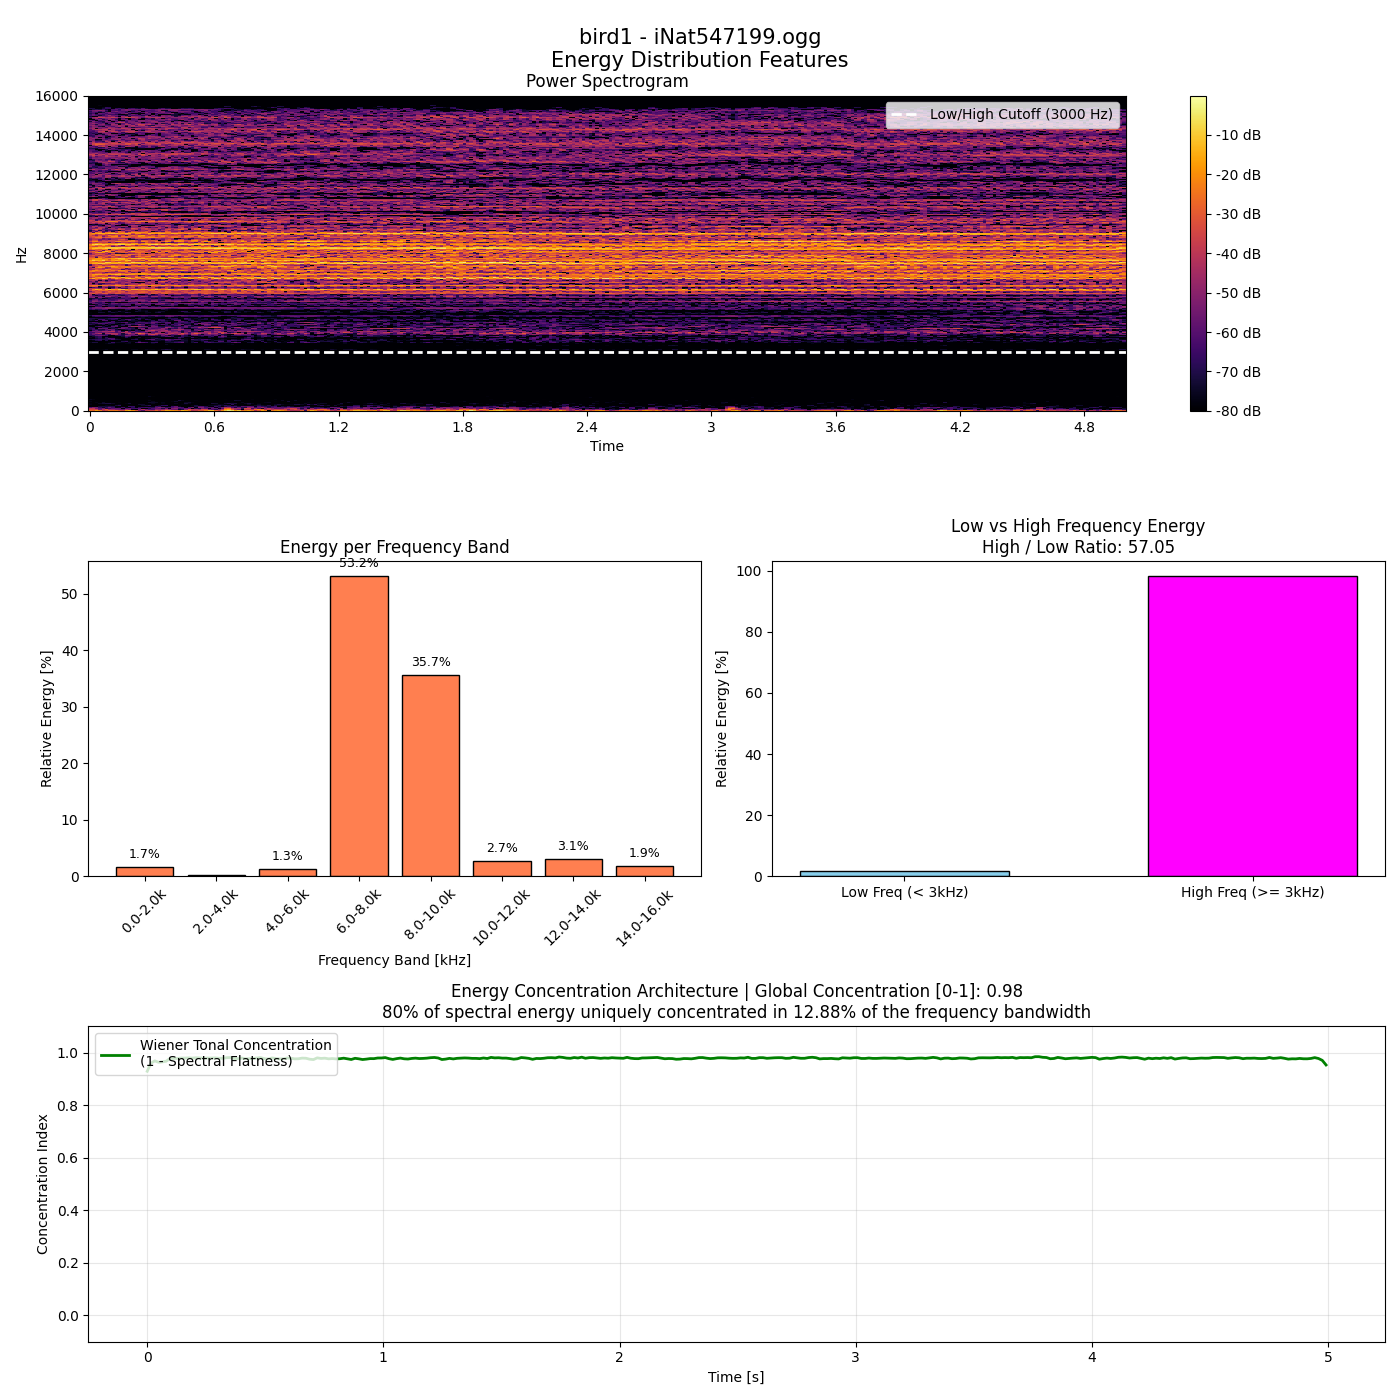
9. Energy Distribution & Handcrafted Filters
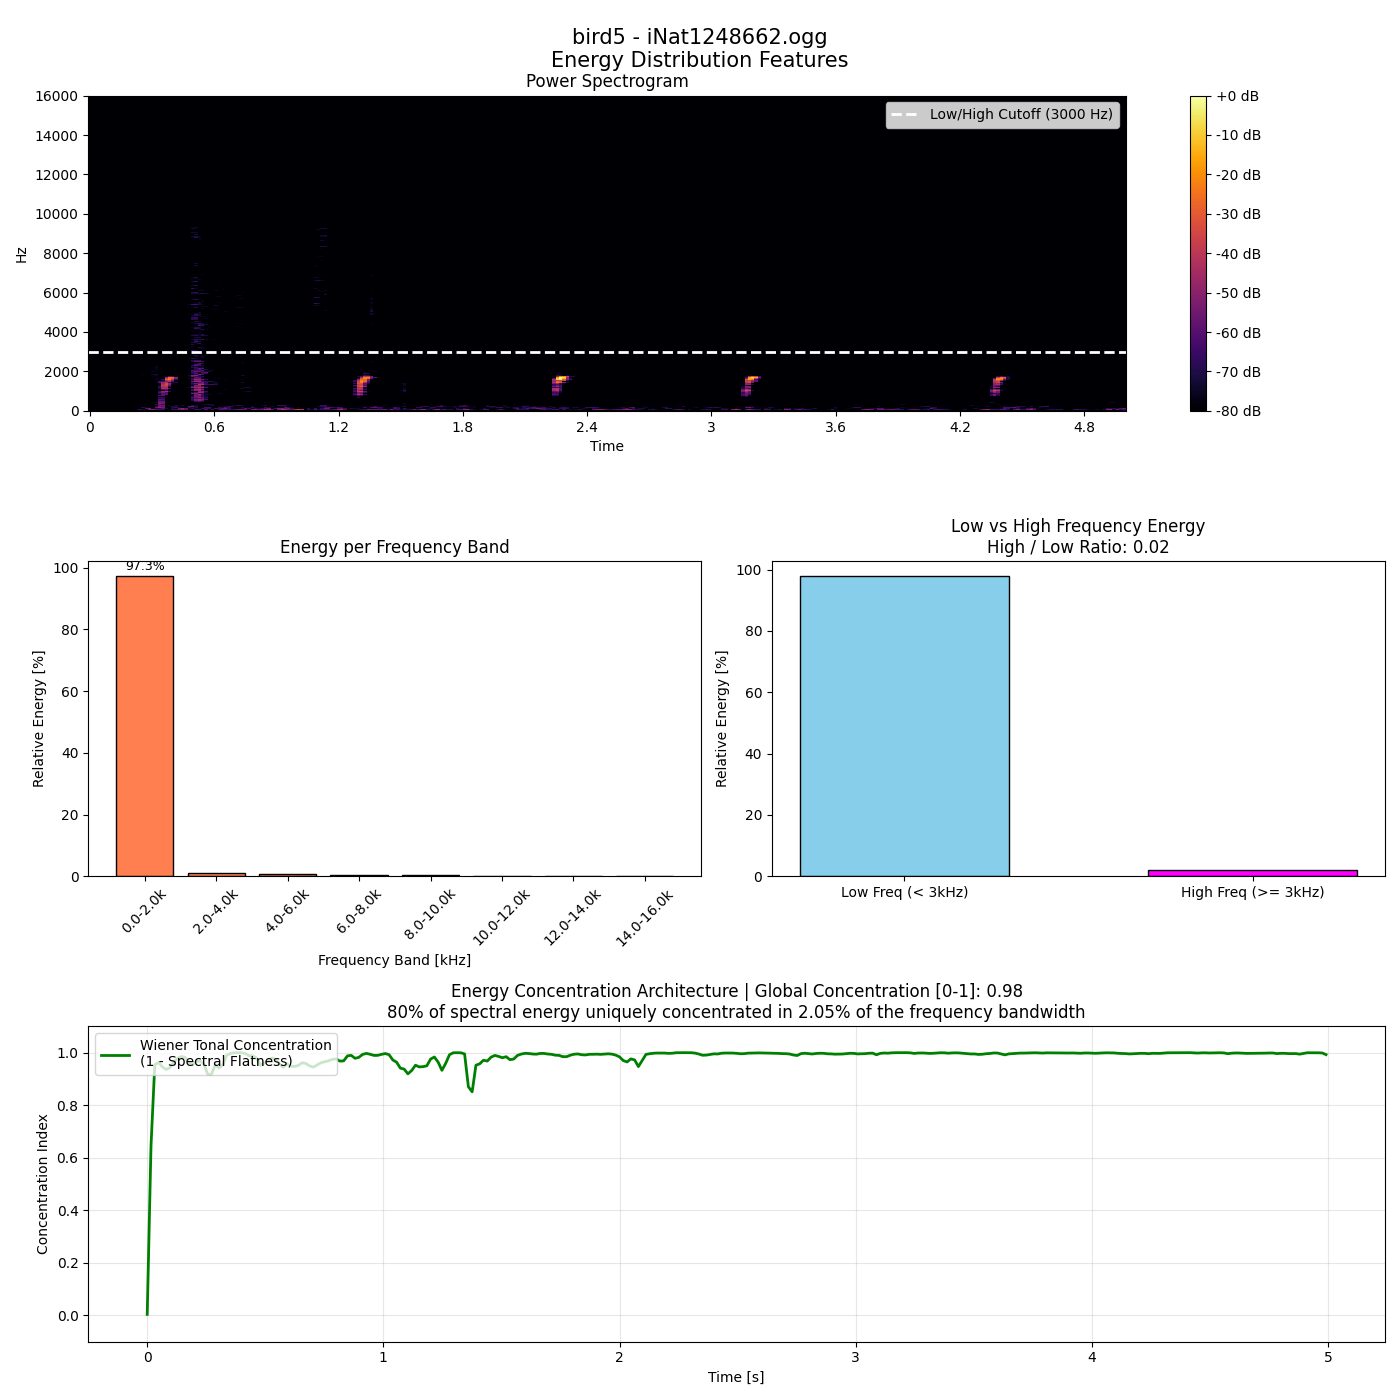
Energy Distribution Across Frequency Bands
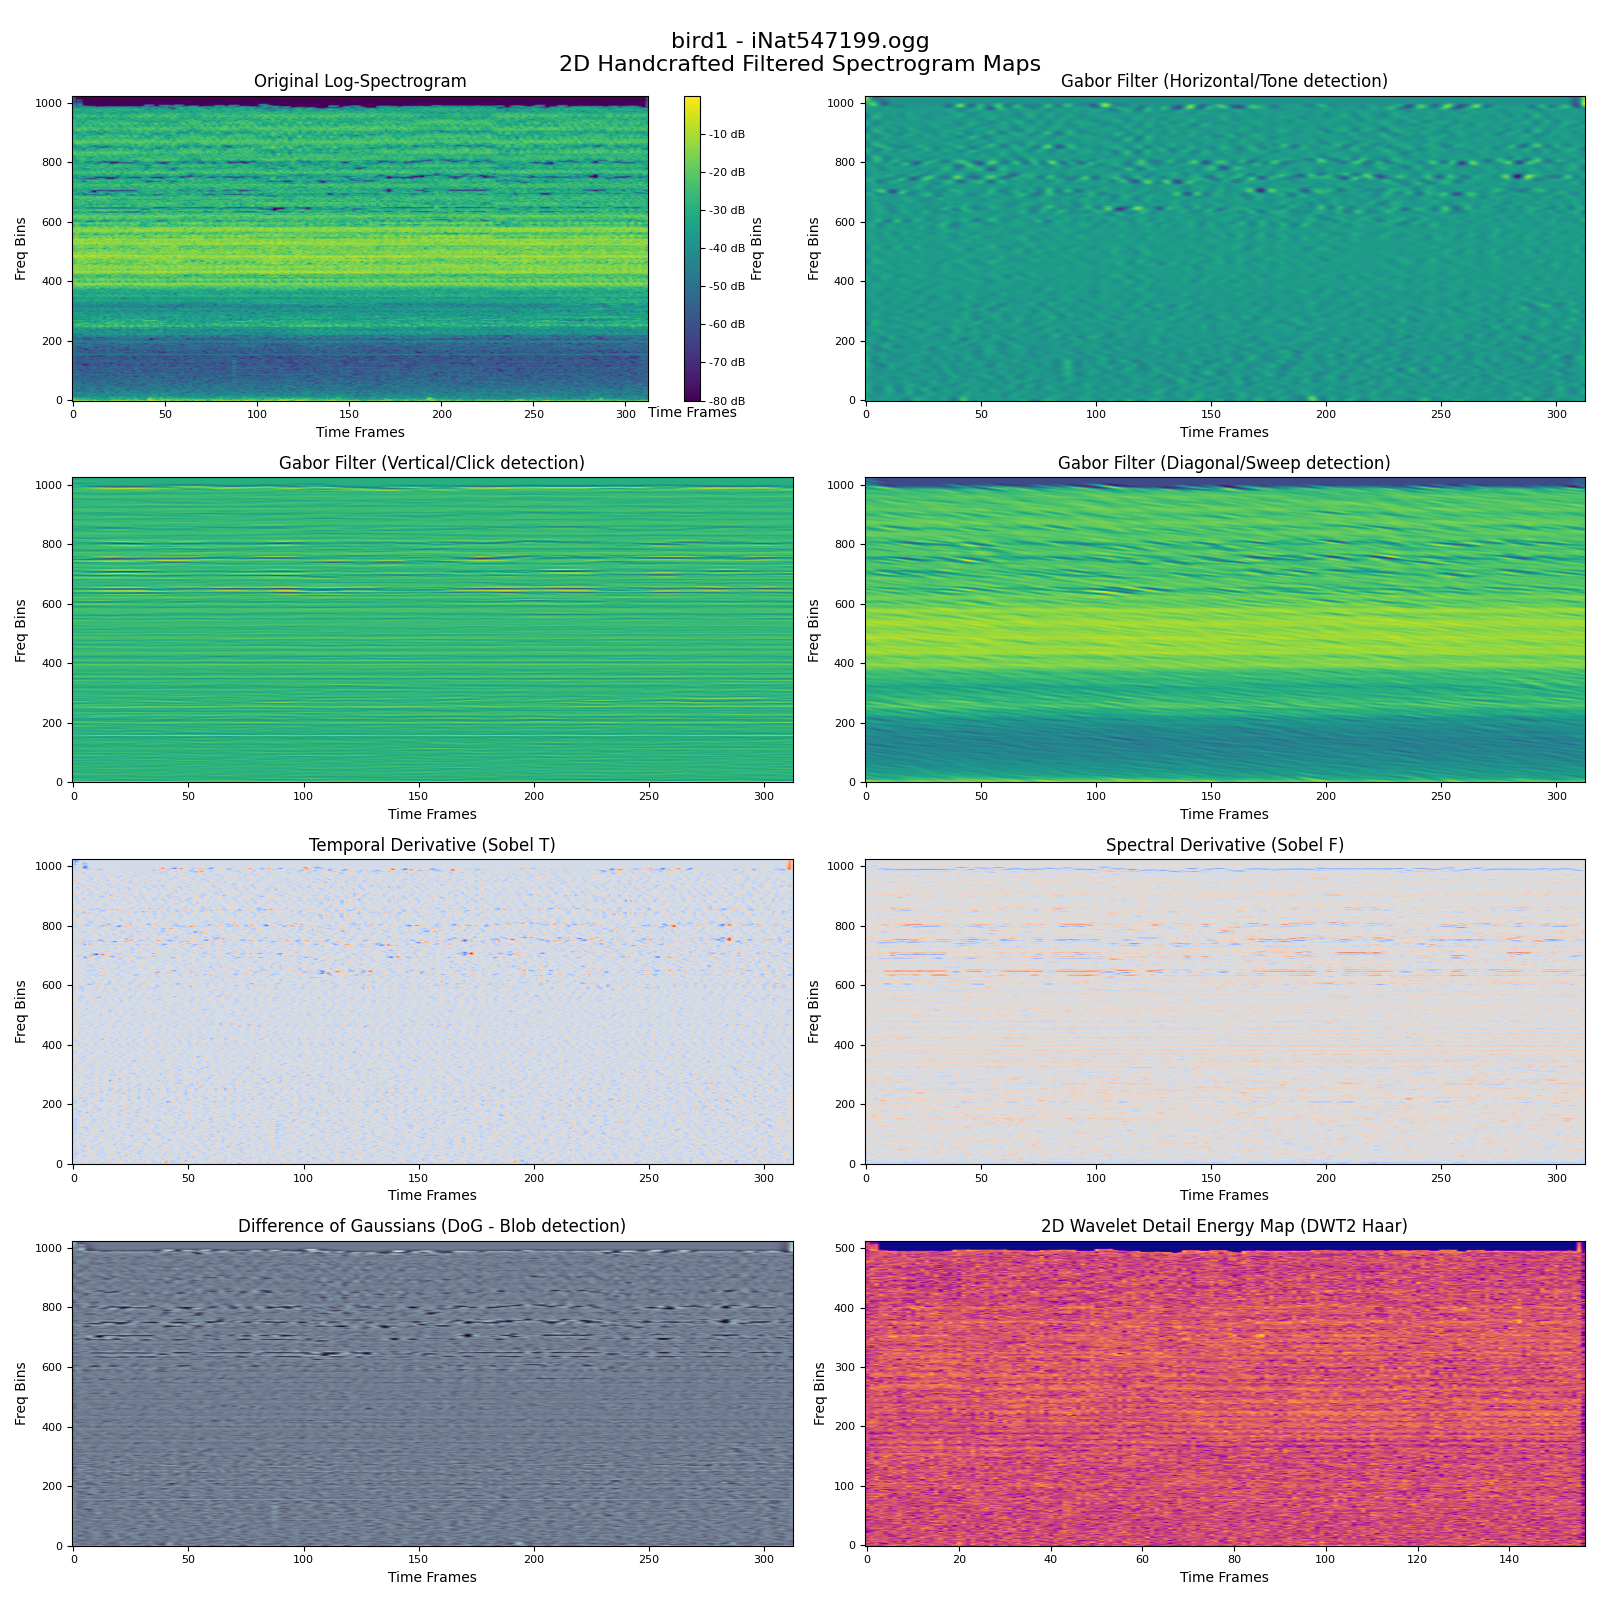
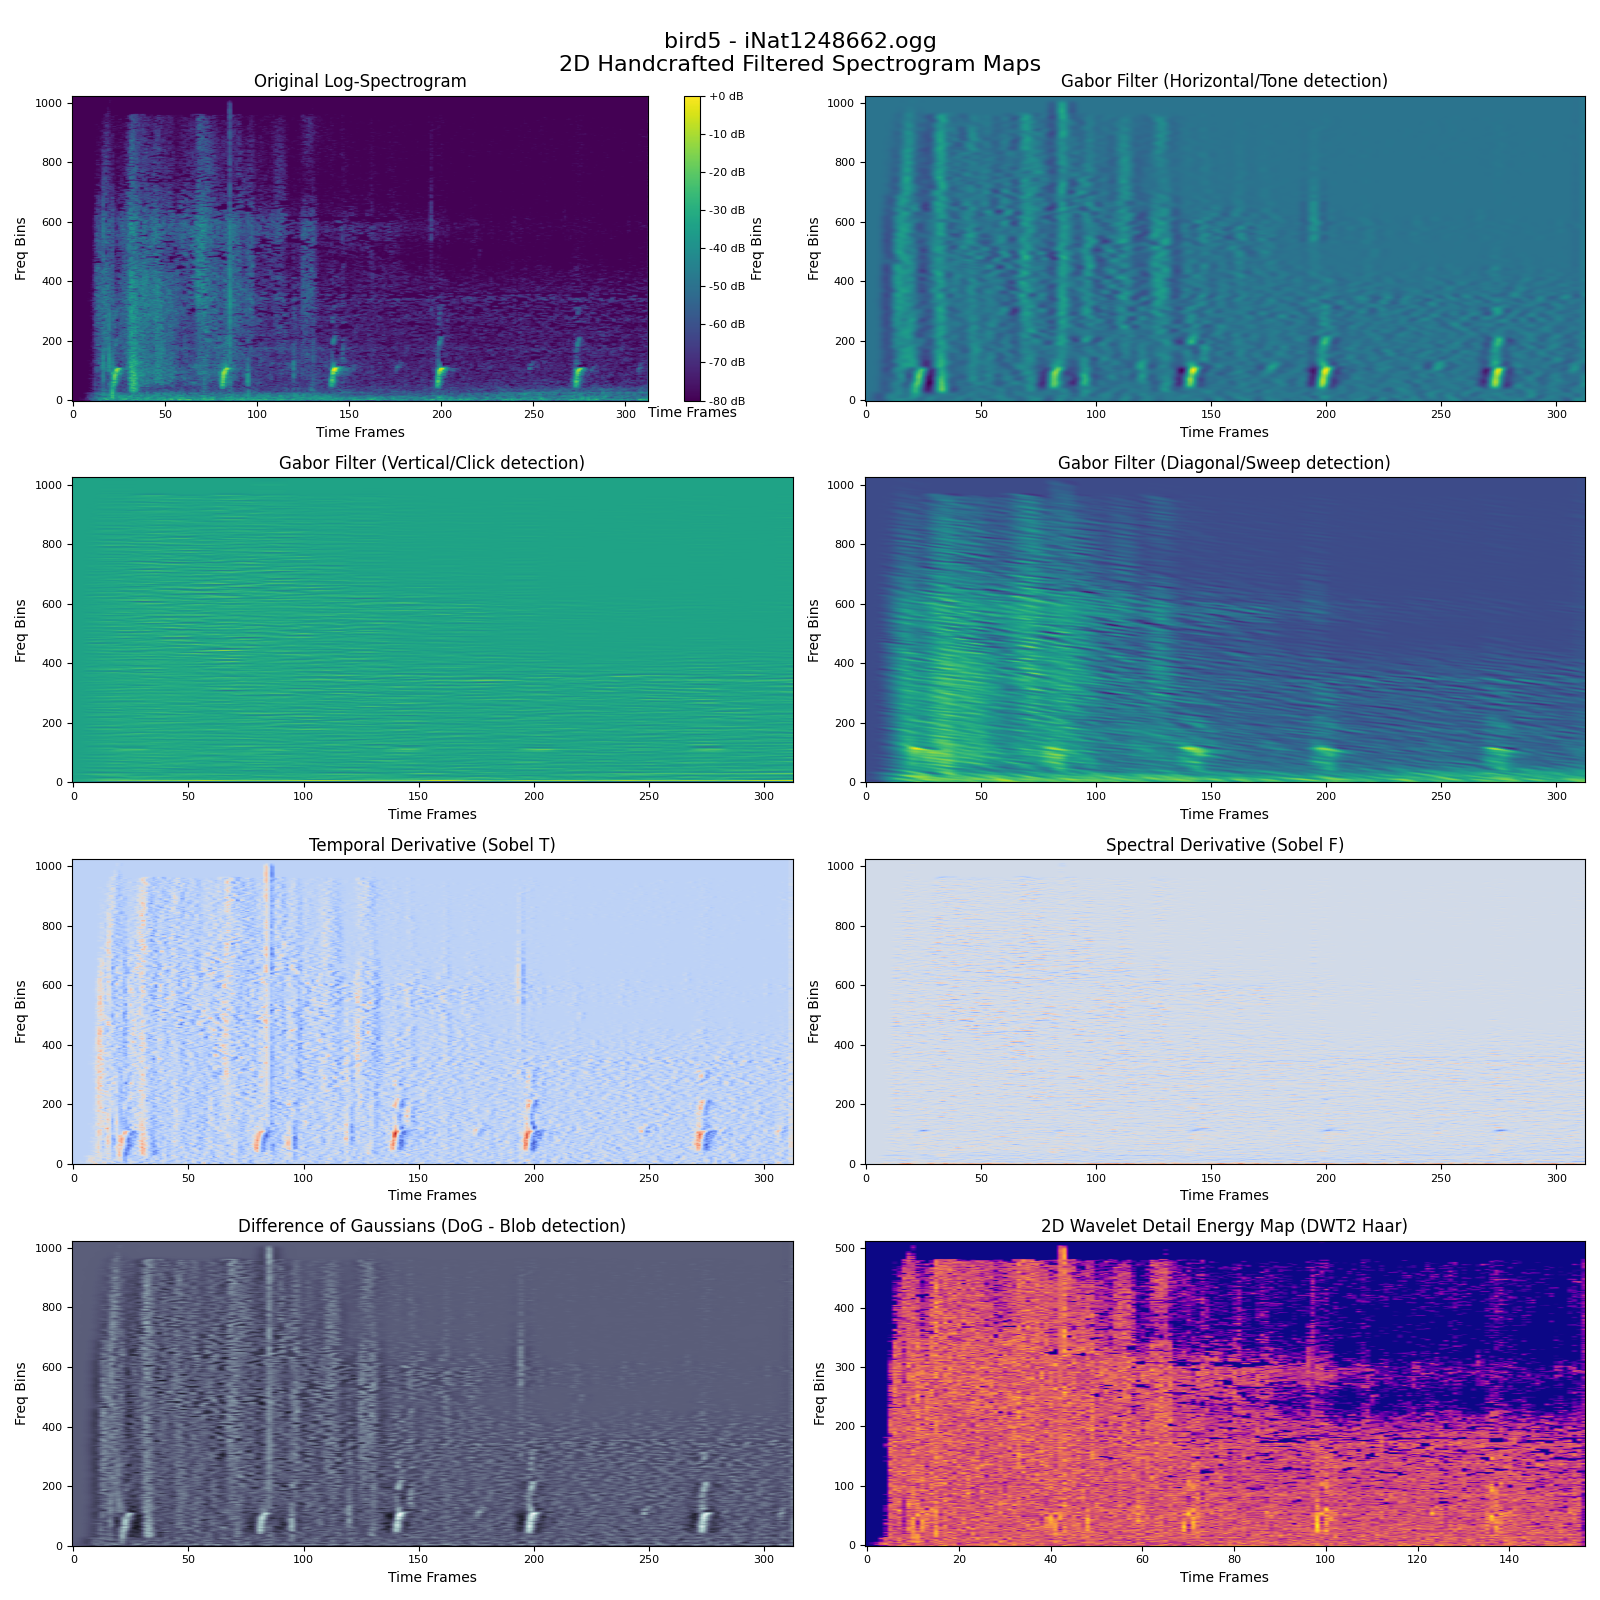
Handcrafted Filter Responses
Observations:
- Bird 1 shows concentrated energy within a narrow band (highly tonal).
- Bird 5 exhibits a wider spread of energy (complex/noisy call).
- Vertical filters highlight chirp onsets and abrupt changes.
- Horizontal filters emphasize harmonic structures.
- Diagonal filters capture the frequency sweeps unique to chirps.
Conclusion
In this study, we explored bird chirp signals using classical signal processing techniques. Starting from raw waveform analysis, we developed a representation based on time-frequency analysis and extracted a comprehensive set of handcrafted features. The exploratory analysis demonstrates that chirp structure, frequency evolution, modulation, and harmonic features provide strong separability. Classical signal processing features remain highly effective for bioacoustic classification and lay the groundwork for machine learning models.
Schuller, B. W. (2013). Intelligent Audio Analysis. Signals and Communication Technology. Springer Berlin, Heidelberg. https://doi.org/10.1007/978-3-642-36806-6